Photovoltaics makes electricity cheap, but only while the sun is shining. In May 2026, a megawatt-hour on the Italian power exchange cost an average of 59 euros at midday between 11 a.m. and 3 p.m., and 160 euros in the evening between 6 p.m. and 10 p.m., more than two and a half times as much. Exactly when solar installations deliver the most, their electricity is worth the least. According to my forecast based on the futures market, the ratio will become even more extreme: in 2031, evening electricity in April and May could cost 2.4 to 7.3 times the midday price, depending on the market zone. Additional midday output is therefore worth less and less. What has value is electricity outside the midday hours: batteries shift it into the evening, and trackers or panels facing east and west generate more in the morning and late afternoon.
The Forecast Behind It
Up front: The figures for 2027 to 2031 are a forecast. It describes what can be expected under certain assumptions and could be well off the mark, especially if the gas market develops differently than expected today. The figures up to September 2026, by contrast, are measured exchange prices from the sources listed.
Created with AI: The calculation model was built by Claude Opus 5.5 (Anthropic). It was reviewed and signed off in seven rounds by GPT-5.5 (OpenAI, via Codex), Gemini 3.1 Pro (Google), Grok 4.7 (xAI), GLM-5.2 (Zhipu) and DeepSeek V4 Pro. The input data comes mostly from public sources: electricity and gas prices from the Italian exchange GME since 2019, load and generation data from ENTSO-E, solar profiles from PVGIS and the futures prices of the ICE Endex energy exchange from October 1, 2026. How my texts are generally created is explained on the About me page.
Legal notice: This post is not investment, financial, tax or legal advice, and not a recommendation to build or buy a solar installation, a storage system or a tracker, or to sell electricity at any particular price. I write as a private individual and am not a licensed adviser. The forecast figures are model calculations. All information is provided free of charge and without any guarantee of accuracy, completeness or timeliness. To the extent permitted by law, I accept no liability for decisions anyone makes on this basis.
Why Electricity Is as Expensive as Gas
On the day-ahead market of the power exchange, all power plants dispatched in a given time period receive the same price for their zone. Put simply, that price is set by the most expensive offer still needed to meet demand. This is called the merit order. In Italy, this last power plant is usually a gas plant: according to the regulator ARERA, combined-cycle gas plants set the price in at least one market zone in 68 percent of hours in 2023 and in 71 percent in 2024.
That is why the electricity price is tied to the gas price. Since 2021, electricity on the exchange has cost 2.3 to 3.8 times as much as gas on a monthly average, and the two curves run almost in parallel. Solar power only changes this as long as it pushes gas plants out of the merit order, and it manages that mainly in the hours around midday.
What Wars Do to the Electricity Price
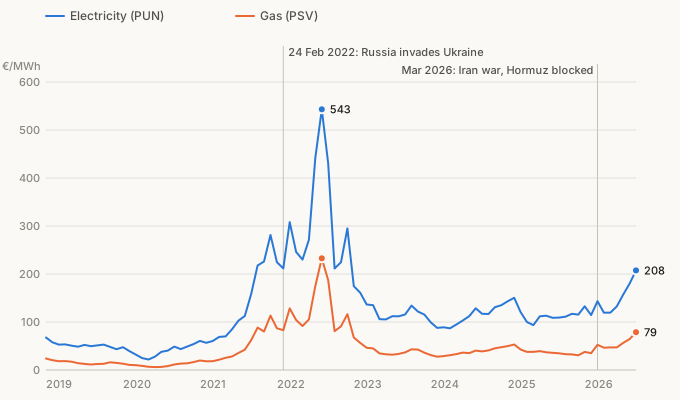
Two wars have demonstrated this. Gas had already become more expensive before Russia's invasion of Ukraine: in January 2021, a megawatt-hour at the Italian trading hub PSV cost 20 euros on average, in January 2022 it cost 87 euros. After the attack on February 24, 2022, it rose to 233 euros by August, and electricity cost an average of 543 euros that month.
The price surge caused by the 2026 Iran war has been smaller so far, but it follows the same pattern. In February 2026, gas cost 35 euros and electricity 114 euros. In early March, Qatar halted its gas production and the Strait of Hormuz was blocked. Since then, gas has stayed above its pre-war level every month. In September 2026 it cost 79 euros and electricity 208 euros.
Where the Price Is Likely to Go by 2031
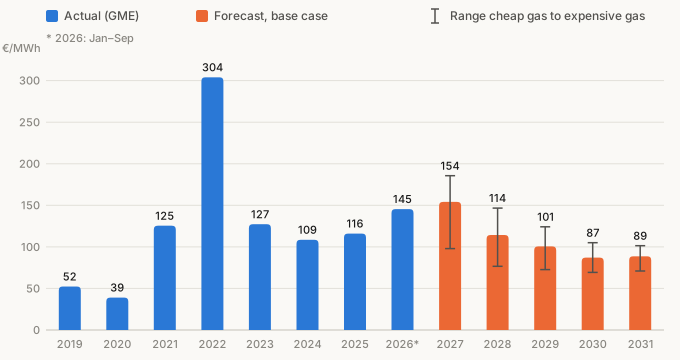
The futures prices of October 1, 2026 assume that the situation will normalize again after the crisis. In the base scenario, which is built on these prices, the Italian electricity price falls from 154 euros per megawatt-hour in 2027 to 89 euros in 2031. For 2031, futures prices only exist for January to August, and the model fills in the remaining months. The gas scenarios show how uncertain this is: in 2029, the price ranges between 73 and 124 euros depending on gas.
Cheap at Midday, Expensive in the Evening
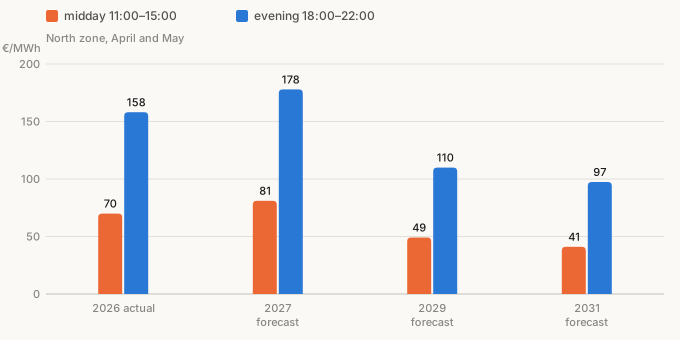
At the same time, evening electricity is becoming even more expensive relative to midday, slightly so in the north and sharply in the south. In the North zone, which includes South Tyrol, electricity cost an average of 70 euros at midday and 158 euros in the evening in April and May 2026. For 2031, the model expects 41 versus 97 euros there, and 13 versus 98 euros in Sicily.
What Solar Power Is Still Worth
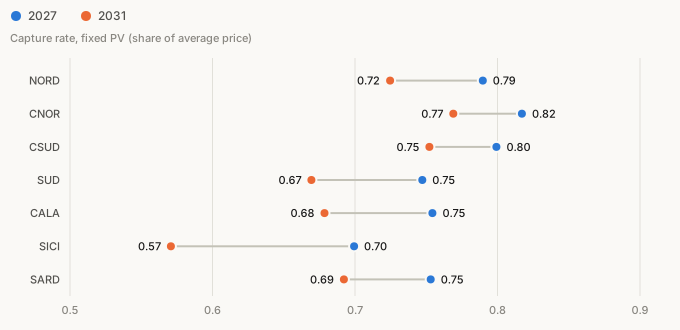
The capture rate compares the average exchange price that solar power achieves with the average exchange price in its zone. Subsidies and marketing costs are not included. For fixed-mount installations, the forecast shows it falling in all seven zones between 2027 and 2031, in the north from 0.79 to 0.72, in Sicily from 0.70 to 0.57. In the south it drops faster because a disproportionate amount of capacity is being built there and the grids cannot yet carry the surplus away.
According to the model, two things have the greatest influence: the gas price and the expansion of grid-scale battery storage. Without new storage, the capture rate in 2031 would be 0.07 to 0.11 points lower, depending on the zone. Negative prices are not factored in, because the Italian day-ahead price never fell below zero up to the end of September 2026.
Sources
- GME (Gestore dei Mercati Energetici), electricity prices on the MGP day-ahead market, hourly values 2019–2026, since October 1, 2025 as the average of the four quarter-hourly prices: Esiti MGP – Dati storici
- GME, MGP-GAS gas prices at the PSV trading hub, daily values 2019–2026: Esiti MGP-GAS – Dati storici
- ARERA, Rapporto sugli esiti del mercato elettrico del giorno prima nel biennio 2023–2024, June 30, 2025 (Annex A to Delibera 302/2025/R/eel): PDF
- Wikipedia: 2026 Iran war fuel crisis (Qatar, Strait of Hormuz)
- Wikipedia (German): Russischer Überfall auf die Ukraine 2022
- ENTSO-E: Transparency Platform (load and generation by zone)
- European Commission, JRC: PVGIS (solar profiles)
- ICE Endex, Italian electricity monthly contracts, closing prices of October 1, 2026 (obtained via TradingView)
- My own electricity price forecast for Italy 2027–2031 from October 3, 2026 (hourly zone prices, base scenario plus gas and expansion scenarios)